
Sensitivity reading done right
Sensitivity reading done right
Leviticus 27:10

Yes, there will be formulas, but it’s all middle-school level arithmetic.
By now, you will probably have heard or read about the latest CAT-stratified, CDC-funded, WHO-authored group-therapy paper claiming that around 1.6 million lives have been saved in the WHO European Region by the Covid vaccines. Splendid vaccine effectiveness against death is being assumed, plugged into a model, and the model can’t but produce huge numbers of lives saved. Models Only Say What They’re Told to Say. I am not too interested in the data that was fed into the model, but in the model itself and its sensitivities.
To illustrate, and to keep the formulas simple, I will forget about doses, and only distinguish between unvaccinated and vaccinated deaths. The formulas I will present are special cases of those on p. 2-3 in the paper’s appendix.1
Consider a certain short period, maybe a week, and an observed number D of Covid deaths. Of these, DU are among the unvaccinated and DV among the vaccinated, such that:
D = DU + DV
These are the other protagonists:
A hypothetical number X of deaths for that period, assuming a vaccination rate of 0%
The vaccination rate q (between 0% and 100%) for that period
Vaccine effectiveness e against death (between minus infinity and 100%)
The model assumes that X can be estimated by scaling unvaccinated deaths from the unvaccinated to the whole population:
DU = X * ( 1 – q )
Alternatively, X can be estimated from the vaccinated deaths by considering not only vaccination rate but also vaccine effectiveness:
DV = X * q * ( 1 – e )
By adding up the two above formulas, we get a relation between D and X:
D = X * ( 1 – q ) + X * q * ( 1 – e ) = X * ( 1 – q * e )
We can then solve for X:
X = D / ( 1 – q * e )
Lives saved by vaccination then amount to hypothetical deaths minus observed deaths:
X – D = D * q * e / ( 1 – q * e )
Now, both X and X – D are multiples of D, and the factors connecting them to D only depend on the product q * e. The following diagram shows the factor 1 / ( 1 – q * e ) for values of q and e between 0% and 95%:
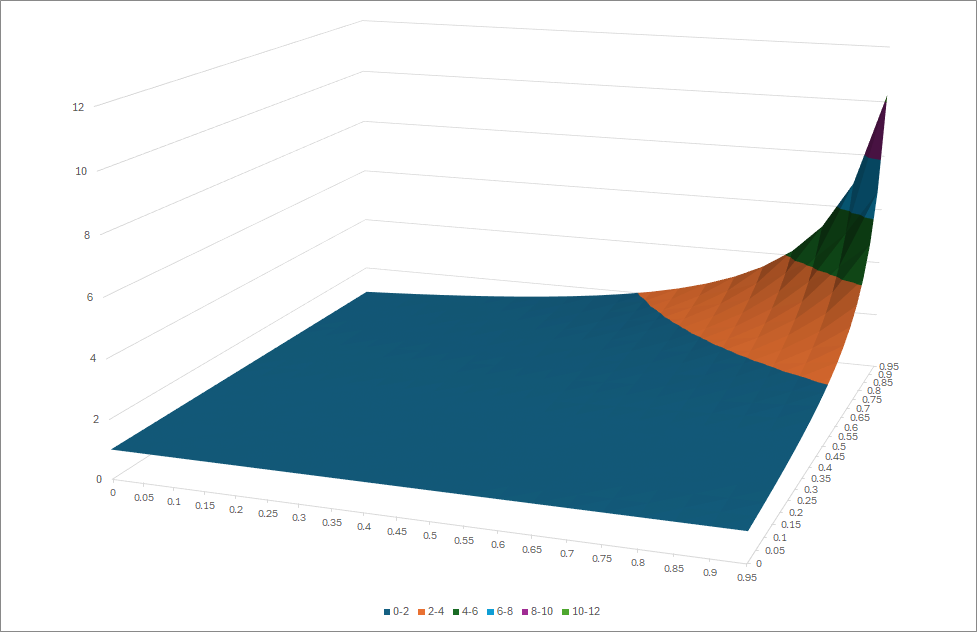
If either q or e are small, the factor 1 / ( 1 – q * e ) remains close to one (and X therefore close to D). Only if both q and e are large (i.e., close to one), the factor 1 / ( 1 – q * e ) suddenly explodes. This means that the model for “lives saved” is very sensitive to vaccination rate and to vaccine effectiveness when both are (claimed to be) large.
To illustrate, the following table assumes 1,000 observed deaths (D = 1000), vaccination rates q = 90% (left) or q = 80% (right), various values for vaccine effectiveness (eff.ness), and then evaluates how the 1,000 deaths are split between the unvaccinated (DU = deaths U) and the vaccinated (DV = deaths V), how many hypothetical deaths X the model would produce, and how many lives would be claimed to have been saved (X – D = X – 1000).
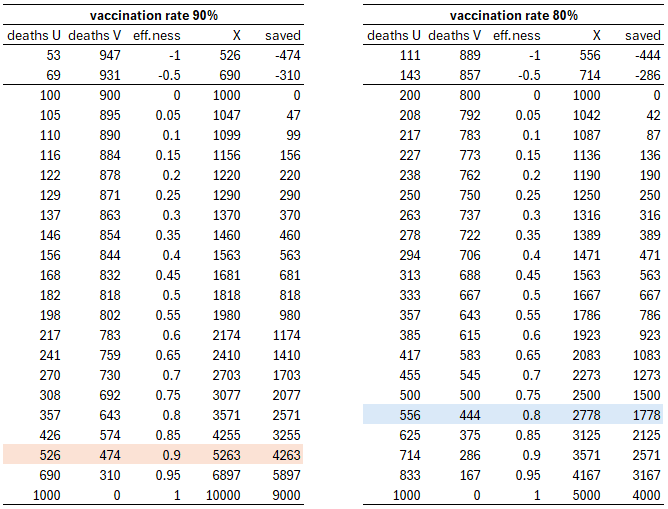
For example (see orange row), even with vaccination rate q = 90% and vaccine effectiveness e = 90%, almost half the deaths would be vaccinated ones. Nevertheless, the model would claim that the vaccines had saved a whopping 4,263 lives. With slightly lower vaccination rate q = 80% and also slightly lower vaccine effectiveness e = 80% (see blue row), the split between unvaccinated and vaccinated deaths would be roughly the same, but only 1,778 lives would have been saved.
Such considerations would not matter in a perfect world where all the variables DU, DV, q and e could be observed (or measured at high precision). Unfortunately, this is neither our world nor the world of the paper. The situation in the paper is the following:
The number of Covid deaths D is observed, but there may of course be the usual issue of perverse incentives (deaths “with” Covid counted as Covid deaths, particularly for the unvaccinated; Covid deaths not classified as such for the vaccinated).
The distinction between unvaccinated and vaccinated deaths (i.e., DU versus DV) is completely disregarded. In particular, there is no check at all if the actual numbers of unvaccinated and vaccinated deaths observed are compatible with what would be expected from the estimates for q and e used.
Vaccine effectiveness e is not estimated from the data but received from on high.
Vaccination rate q is taken from external sources as well, and not even subjected to sensitivity analysis (the sensitivity analysis done in the paper is crap anyway).
In a situation like this, things can go off the rails quickly, as illustrated by my example from the above table. Even a claim of 80% vaccine effectiveness against death is laughable, but even if it was not, nobody would be able to estimate effectiveness to high precision. Same with vaccination rate: it is illusory to think that number of vaccine doses divided by population size gives accurate estimates of vaccination rates, particularly as time progresses. Both vaccine effectiveness and vaccination rate might be much lower than assumed, and since the model depends on the product of these two numbers (it needs both numbers to be high in order to produce large numbers of saved lives), it very likely wildly exaggerates numbers of saved lives.
If only vaccines (and “vaccines”) were put through large-scale, double-blind, independent, long-term control studies before being let loose in mass experiments…
See also this analysis (in German): https://tkp.at/2024/08/18/corona-injektionen-und-die-geretteten-leben-irrsinn-durch-numerisches-voodoo/
Nice. I was doing something similar after the large number of Covid deaths, summer 2021...
https://open.substack.com/pub/inumero/p/can-vaccines-be-90-effective-at-reducing?r=tv61s&utm_campaign=post&utm_medium=web