

And they had brick for stone, and slime had they for morter
Genesis 11:7

As a mathematician, I can‘t help processing most topics through the math shredder. As Goethe said: “Mathematicians are like Frenchmen; if one speaks to them they translate it into their own language, and then it will be very soon something entirely different.” In this post, building on earlier musings and this post by Rudolph Rigger, I will lay out my stream of mathematical consciousness regarding the interplay of virus outbreak and vaccination uptake.
Virus outbreaks often start slowly, gain speed, run rampant, and then peter out. Mathematical models for such phenomena make use of sigmoid functions, a prominent example being Gompertz functions. These are of the form
g(t) = A · exp(B · exp(C · t))).
The parameter 0 < A < 1 is the upper asymptote (eg, the final proportion of the population that will be infected by a virus). The parameter B < 0 shifts the function to the left or to the right (more or less), the parameter C < 0 determines steepness.
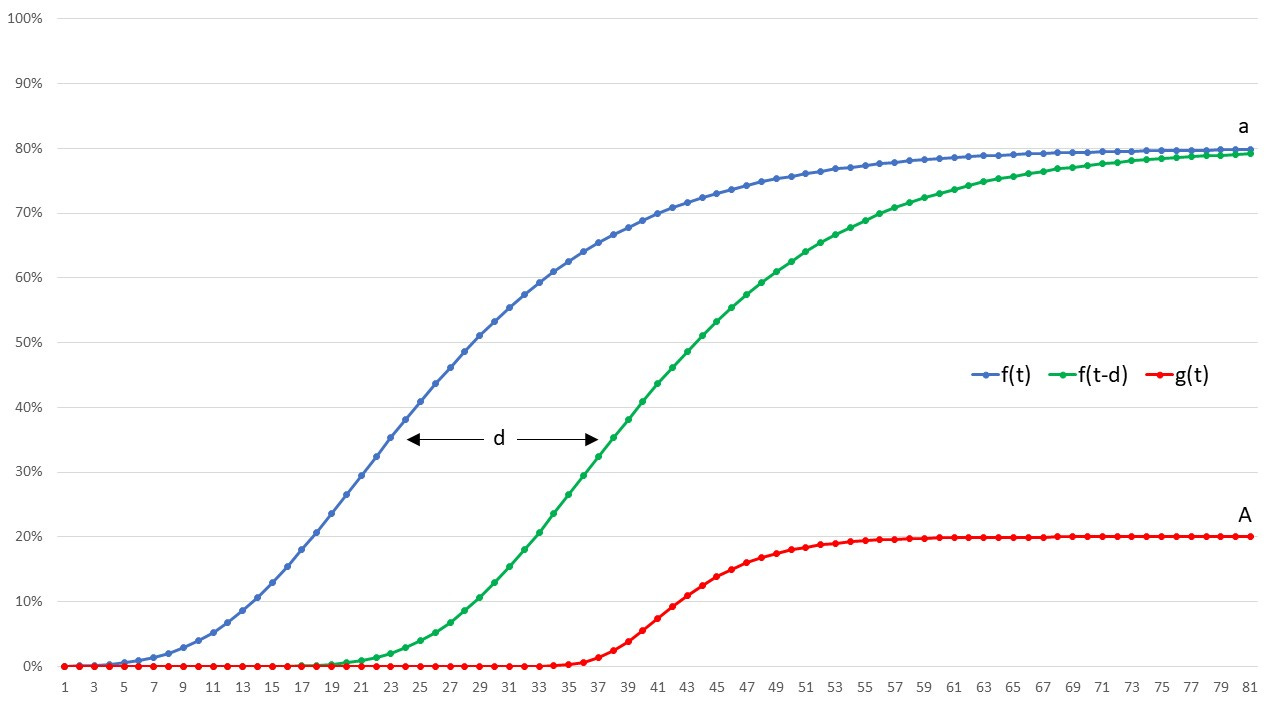
Now, it seems to me that vaccination uptake can be modelled using the very same class of functions, say f(t) = a · exp(b · exp(c · t))). The unvaccinated proportion of the population at time t is u(t) = 1 – f(t). Until d days after vaccination, vaccinees will remain in vaccination limbo (where the wonders of the vaccine have not materialized yet); their share of the population at time t is l(t) = f(t) – f(t – d). Finally, at time t, a proportion of v(t) = f(t – d) will be considered having been taken up in vaccination heaven.
In order to play with these models, let’s fix parameters. B = b = -1 will do; shifting in time will be done using another parameter D (we will look at g(t – D) instead of g(t)). The choice A = 0.8 indicates a massive vaccination campaign, a = 0.2 a quite serious virus spread. And C = -0.25 versus c = -1.0 expresses that the virus is much faster than the vaccination campaign. A sensible choice for time in vaccine limbo is d = 15 (days). The following diagram shows some of the functions involved, for the case D = 20.
It might be interesting to perform such calibrations to real-world data, both for vaccination campaigns and for virus outbreaks, but the fun is in the combination. Let us assume that the two phenomena simply overlap but do not influence each other. In other words, the vaccine is completely useless but also completely harmless. Each infection with the virus will happen when in a certain state (ie, unvaccinated, in limbo, or vaccinated), and we are interested in the respective proportions once the whole show is over. The only parameter left is the shift in time, D. In order to compute the proportions U(D), L(D) and V(D), we will have to – gasp – differentiate and integrate:
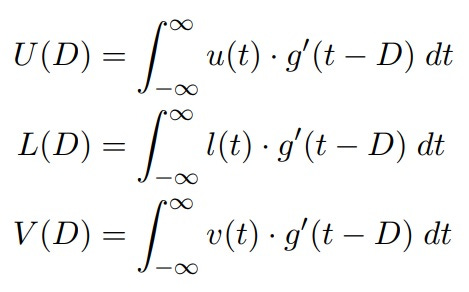
Of course, we have U(D) + L(D) + V(D) = A, so it will suffice to compute two integrals for each value of D. Differentiation of g is easy, and integration can be delegated to R, or your mathematical software of choice. The following diagram shows the resulting proportions for a range of values for D (the curve for L(D) exhibits some bumps around D = 66, possibly due to R having some problems with cancellation):
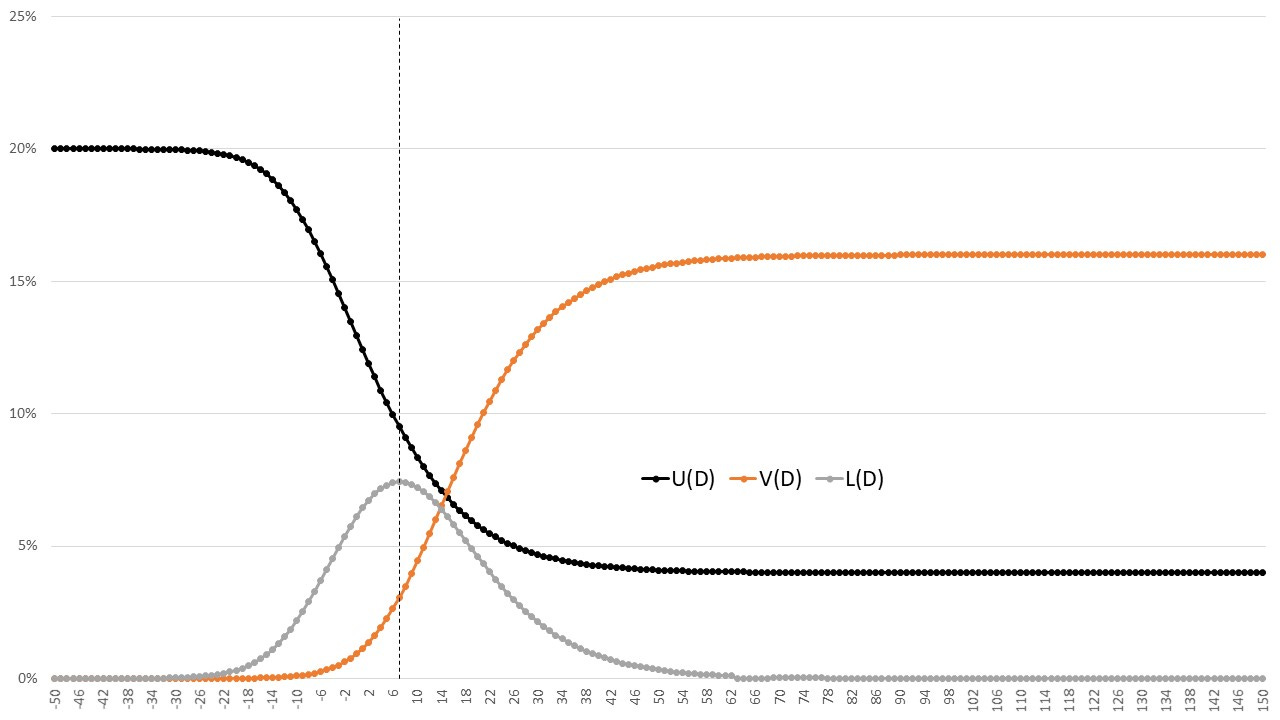
If the virus outbreak precedes the vaccination campaign, all infections will count as unvaccinated, therefore U(D) approaches 20% to the left. On the other hand, if the outbreak starts when the campaign is finished, almost 80% of the population will be vaccinated, almost nobody will be in vaccination limbo, and 20% remain unvaccinated. Therefore, U(D) approaches 4%, and V(D) approaches 16%.
The interesting stuff happens somewhere in between. The number of limbo infections can rise to over a third of all infections. This happens around D = 7. Here’s the very first image from this post, with the outbreak shifted from D = 20 to D = 7:
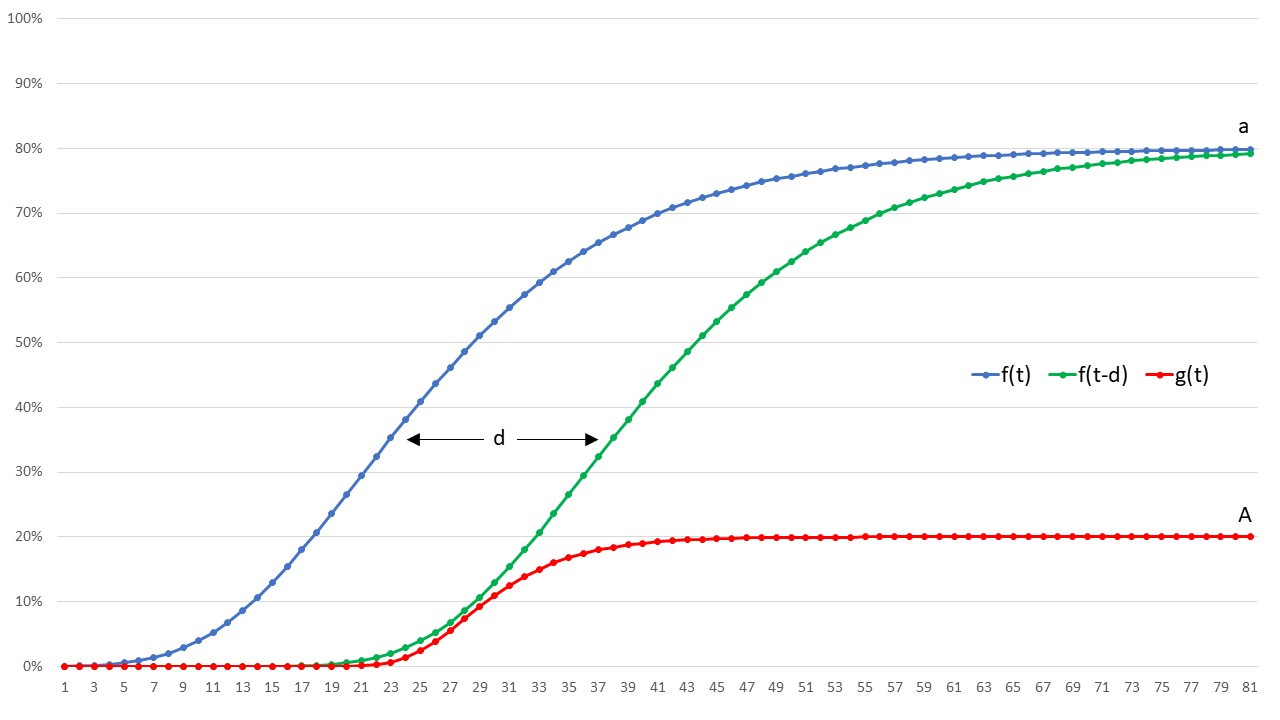
Here the vaccination campaign and the outbreak are running almost in parallel, until the virus loses interest.
What can we learn from this simple modelling experience? At least, if you vaccinate into a pandemic, be prepared to see all kinds of weird effects. These might overshadow any real benefit or harm.
If we wanted to include aspects like
the vaccination being effective regarding prevention of infection,
the vaccination actually increasing susceptibility to infection (all the time or in limbo only),
very different effects of virus and vaccine to sub-populations (eg, age groups),
we would quickly find that analytical models fail, and we would resort to Monte Carlo simulation. In order to incorporate all desired phenomena, we would introduce tons of parameters and tweaks, until the wrath of the formidable William M Briggs descends upon us.