

Deaths in Germany, 2022/2023 update
Ezekiel 45:10


I have commented on deaths in Germany before. Now that data for the first half of 2023 are in, I will follow up, and shift focus from calendar years to seasons (July to June). Both population data and deaths data are available from destatis, the German statistical office. For comparison, I also recommend Ulf Lorré’s analysis (also this update), and (for speakers of German) the videos of Raimund Hagemann and Marcel Barz referenced therein.
Let us start with year-end population figures, stratified by age group (as will later fit with the deaths figures):

The population grew quite a lot in 2022, mainly due to immigration from Ukraine. Actually, we can zoom in further. For example, the number of 64-year olds at the end of 2022 can be decomposed as follows:
the number of 63-year olds at the end of 2021
minus those who were 63 years old at the end of 2021, and died during 2022
minus those who were 63 years old at the end of 2021, and emigrated to another country during 2022
plus those who were 63 years old at the end of 2021, and immigrated into Germany during 2022
Of these four, usually 1. is by far the largest contributor, and by plotting the differences for all age groups (n-year olds at the end of 2022, minus (n-1)-year olds at the end of 2021) we get an impression on (a) what the total effects of 2. to 4. are, and (b) what has been happening to the population in general. The following image does this for all ages from 1 to 84 (unfortunately, destatis does not split the 85+ age group any further).

Somewhere around the age of 50, the effect becomes negative. That is, more people die or emigrate, than immigrate. To the right, you can see a certain drop-off making its way through the years, which is an afterglow of WW2: those aged 77 at the end of 2022 were born in 1945, and all through the war birth rates were low.
For the younger age cohorts, 2015 (dark blue) and 2022 (red) stand out as immigration years. The rise at 18 is interesting, also in combination with the small plateau at 17 for the year 2015 (at the time, there was some discussion around the “true” age of immigrants). The story of 2015 is one of individual immigrants, the story of 2022 is one of families (from Ukraine).
To the sum total of these effects (“shift 1-84”) we have to add the 0-year olds at year end (“effect 0”, again: births minus deaths minus emigration plus immigration) and the effect in the 85+ group (“effect 85+”: 85+ year olds minus 84+ year olds from one year before), and we get the effect on the total population:

And then we have deaths by season (from July to June):

Here are the figures from the “total” row in a diagram:

Looks a bit scary, doesn’t it? But let us be careful. Raw deaths figures do not account for population size and age structure. Dividing numbers of deaths by population as of the middle of the season (i.e., year end), we get mortality rates:

As before, I computed ranks (1 = largest rate among the 13 years, 13 = smallest rate) and painted them (1 = red, 13 = white):

The 2018/19 and 2019/20 seasons should have produced lots of dry tinder. And consider the amazing fact that the 2019/20 season contains the “first” Covid wave, i.e., the one of spring 2020! The strange peaks observed in places like Northern Italy, New York, the UK and Sweden are not visible in Germany. The seasons 2020/21, 2021/22, and 2022/23, however, were pretty bad. But how bad?
Now that we have computed mortality rates by age group, we can standardize deaths by applying these mortality rates to a fixed population. I chose the population as of 31.12.2022, which leaves the 2022/23 deaths figures as they are. This is what we get:

Now the 2022/23 season only comes in second place, right after 2012/13. Does this mean that everything is fine? Probably not. Causes of death are competing with each other, and disruptions do not have to manifest in the total number of deaths. One way to see this (again, as indicated before) is the distribution of deaths troughout the year.
For this exercise, I had to stratify by month (age stratification of deaths is not available for days, or calendar weeks). In a first step, I divided by the number of days in the month to make months comparable (your average January has more than 10% more days than your average February). This is what we get in terms of raw deaths figures:

The total grey area (dark and light grey combined) marks the span of average daily deaths from the 2011/12 to the 2019/20 season (dark grey is 2016/17 to 2019/20 only). Peaks were typically reached in February or March back then. The seasons since 2020/21 have been different. Most of the deaths have been taking place in the second half of the year, peaking in December.
But again, the diagram is misleading because it does not consider the growing and ageing population. Here is the modified diagram, where all deaths have been scaled, by age group, to the population as of 31.12.2022 (so that the green 2022/23 curve remains the same). The dark grey lines show the worst pre-2020 seasons. Note that here it becomes clear that the monthly resolution is not optimal: sometimes the “respiratory peak” seems to occur in a single month, sometimes flattened out over two months. In reality, it is more likely to always be of similar shape.
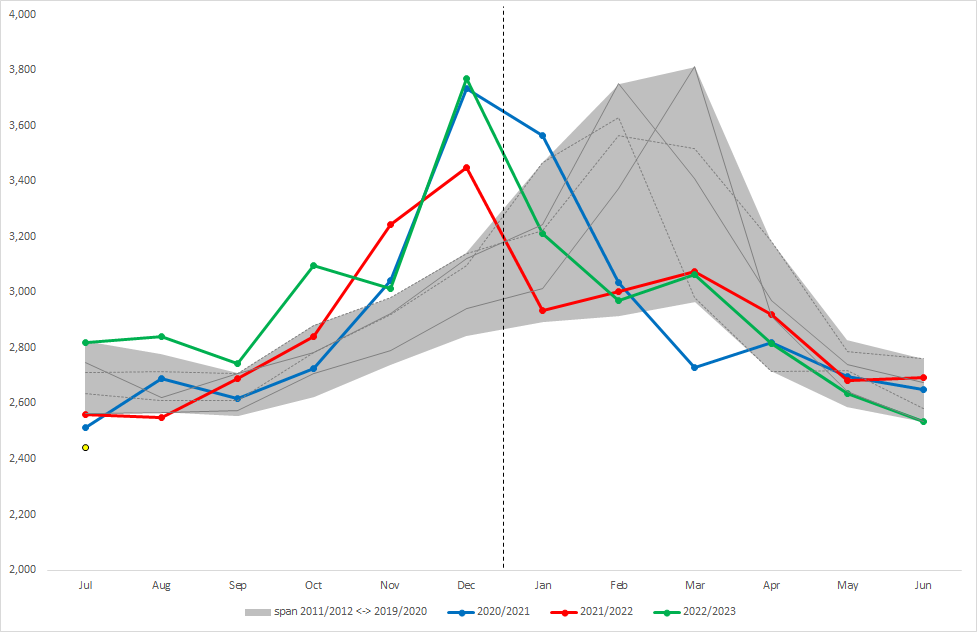
The grey area has been shifted upwards, and as indicated above, the total numbers of deaths in the 2020/21 to 2022/23 seasons are not that unusual. The shifting of the peak, however, still is, as well as the final two months of 2021, and the complete second half of 2022. What kind of booster had been applied to deaths there?
And I have got a bonus for you. Attentive readers will have noticed the yellow dots above “Jul(y)” in the above diagrams. These indicate the first month of the 2023/24 season. Boy, did the Lauterbachs of this world try to scare us into fear of heat deaths…
Amazing work. So, it looks like deaths are well in the expected range for every year but pulled forward 2 to 3 months of each of the pandemic years?
Thanks CM, great post. I've been wondering for a while whether a harvesting effect was to be expected after 2020/21 instead of two more over-mortal seasons.