

European births, Q1 2025 update
Proverbs 14:12

This is the Q1 2025 edition of my collection of monthly and annual births data for Europe (for a guide to the Excel file, see the bottom of this post). Note that I had to interpolate some data for Switzerland (it always takes some time until the Swiss publish final monthly results for the preceding year).
As before, I plotted monthly births against the 2017-2020 median (in the Excel file: “months_vs_4” for the data, and “diag_vs_4” for the diagram), and computed quantiles of the resulting distributions of quotients (Example: 89% median (red line) for Jan. 2023 means that 13 of the 28 countries considered recorded less than 89% of the median for Jan. 2017-2020, 13 recorded more, and 89% is the mean value for the two countries in the middle). As an alternative (with very different weighting of countries), for the dashed red line, I summed births per month over all 28 countries, and then compared to the 2017-2020 median.
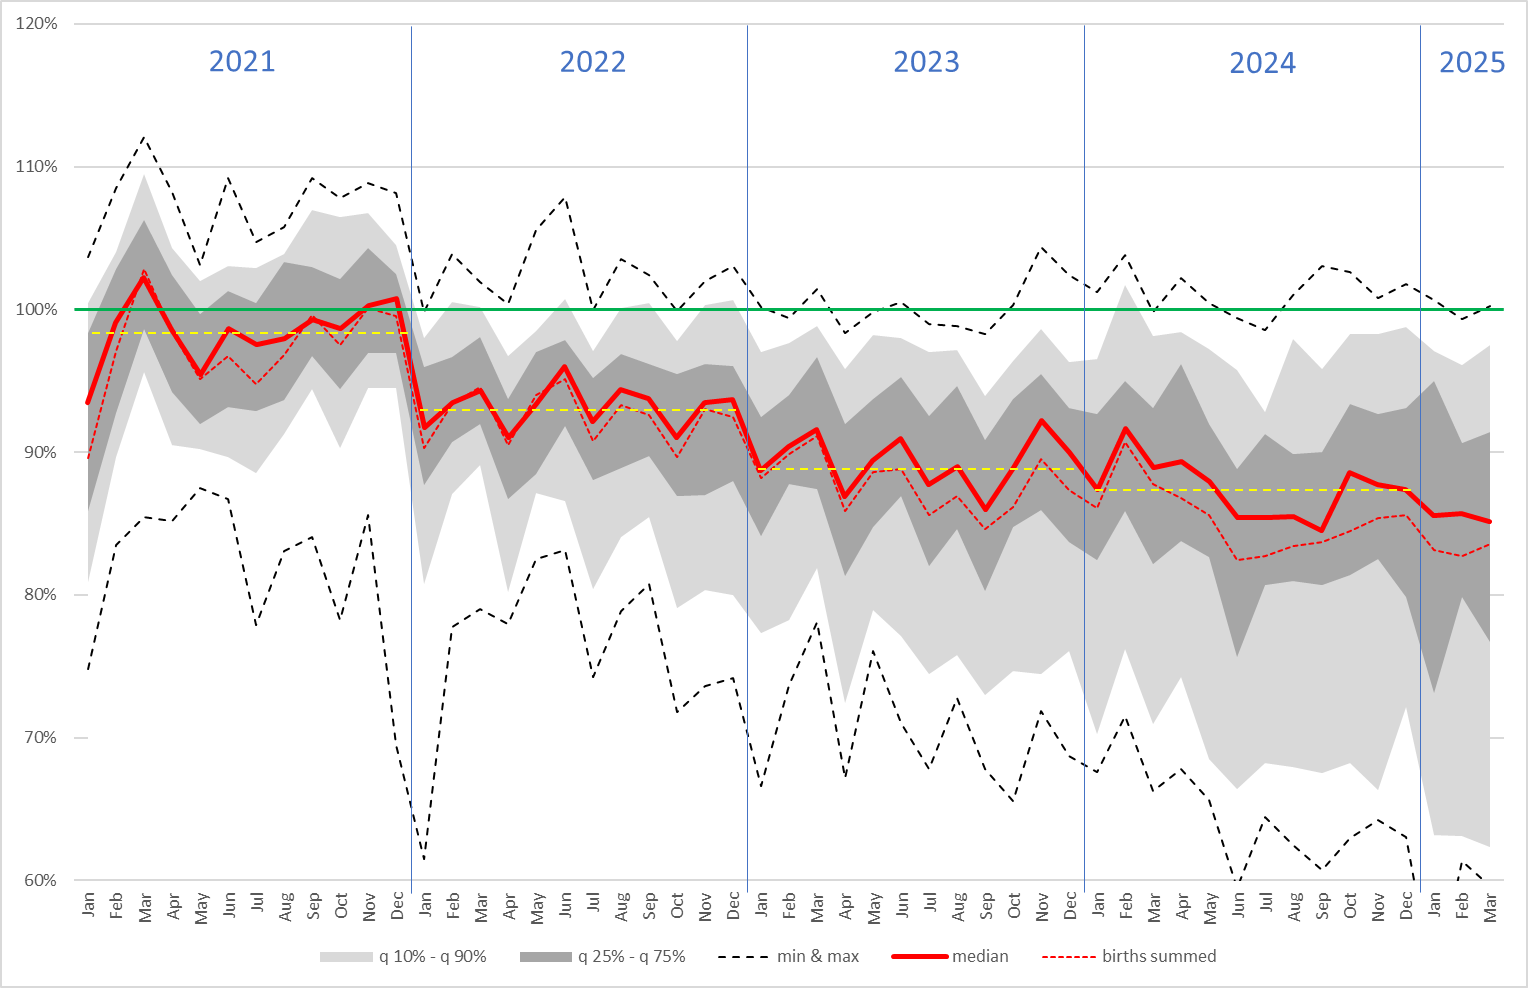
Things look in 2025 as they did in 2023 and 2024. Monthly births are on the way down; both the beginning of 2022 and the beginning of 2023 seem to mark cliffs. Go back nine months from there to investigate. The countries sharing a border with Ukraine or Russia are worst off (and the Russians are even classifying monthly births data now). Dear warmongers in the European Union and elsewhere, can you see what you are doing (and why do I have do drag such comments along for years)? Note also that whenever things go rough in Israel, the statistics servers are not available for some time.
Guide to the Excel file:
sheets “home” and “diag”: cumulative 2022-2025 figures for up to 40 countries against the 2017-2021 median
sheet “years”: overview of annual births 2017-2023, including ranks (update including 2024 pending; data for 2024 is still missing for England and Wales)
sheet “months_total”: alternative (sum births over countries, then compare to 2017-2020 median)
sheet “months_vs_4” and “diag_vs_4”: monthly births for 2021-2025 against the 2017-2020 median
country sheets: data on monthly births and deaths; diagrams (“b”) show cumulative annual figures against the 2017-2021 median (as in “home”)
Thank you for your sad work. Hard to watch for those who saw it coming in 2020 …
Thank you very much!