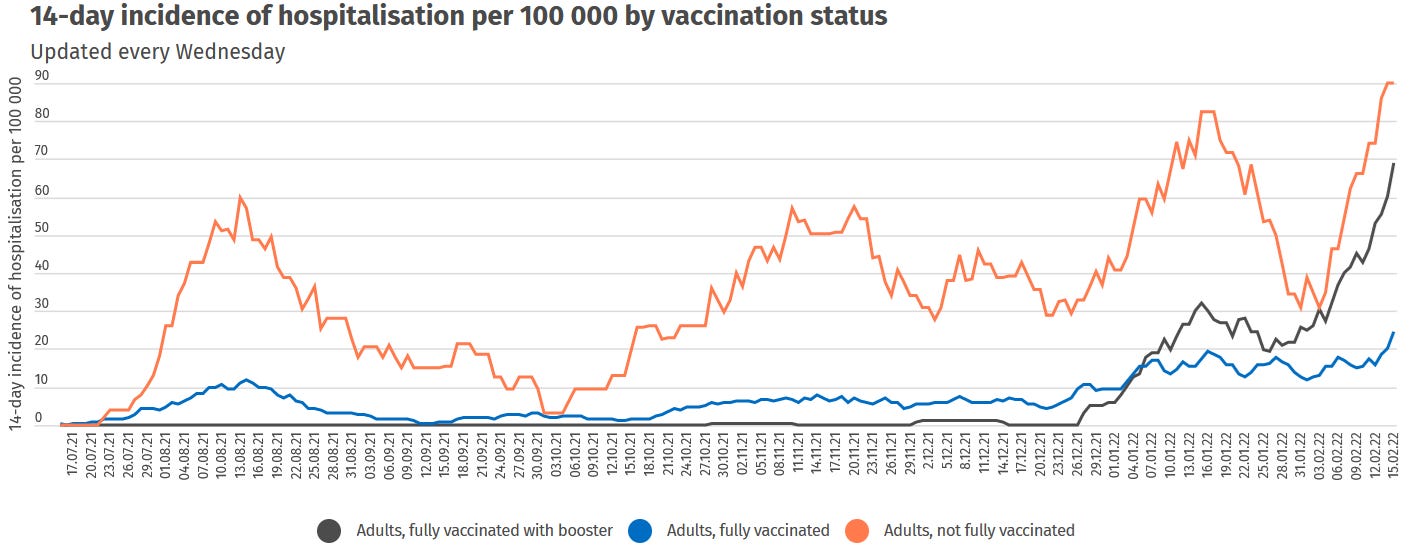
Iceland publishes quite solid Covid data. On the Covid statistics page (fortunately available in English; Icelandic is quite a beast of a language; I learned about this in an earlier instantiation of this lecture series) I have been struggling with this diagram:
So the unvaccinated (orange) seem to be hospitalized at higher rates than the vaccinated. The boosted (black) are keeping up, but what about those “fully vaccinated” (blue)? Is it advisable to stop after two jabs, or is something else going on?
Let’s start with the unvaccinated. The first thing to notice is the jagged nature of the graph. Luckily, the data behind the diagram are available for download. Here’s a plot of the daily difference in incidence, going back one month from February 15th:
Yes, it’s all multiples of (something like) 3.9. This is the result of computing an incidence per 100,000 for a much smaller population. A single unvaccinated person entering or exiting a hospital will increase or decrease the incidence by 3.9. The total number of people behind the incidence of 90 (as on February 15th) is therefore 90 / 3.9 = 23, and the unvaccinated adult population stands at around 23 x 100,000 / 90 = 25,641. Note that the incidences are given to us at one-digit precision, so there’s some rounding error involved, but the 23 is certain.
Can we do the same computation for the boosted? Turns out to be difficult. For example, from January 23rd to 24th, the incidence climbs from 24.3 to 24.5. Considering rounding error, the real change in incidence might have been between 0.1 and 0.3. And the reason might be new hospitalizations, or a change in the denominator, i.e., in the headcount of the boosted, or both. Here it makes more sense to start with this headcount. According to the vaccine statistics page, it amounts to around 200,000 (a bit more altogether but the hospitalizations diagram is only dealing with adults). An incidence of 68.9 means 68.9 x 200,000 / 100,000 = 137.8 ≈ 138 people in hospital.
Note that the rounding error in the incidence will be doubled in this computation, which is not much of a problem (if the real incidence is 68.85, we get 137.7; if it’s 68.95, we get 137.9). If we assume the upper bound of 68.95 and throw in all the boosted (201,507) we land at 138.94 ≈ 139. A lower bound for the number of boosted adults needs more work. Adults constitute around 75% of the population (of around 364,000). Only 1% of children 12-15 are boosted. If their share of the children population is around 4/18, this gives 1% x 4/18 x 25% x 364,000 ≈ 200. Add 50% boosted for children 16-17, which means 50% x 2/18 x 25% x 364,000 ≈ 5,000. So it is quite safe to assume that the number of boosted adults exceeds 196,000. We get a lower bound, for the number of boosted, hospitalized adults, of 68.85 x 196,000 = 134.9 ≈ 135. Let’s stick with this figure. Here’s the diagram of recent daily changes in incidence, with 68.85 / 135 = 0.51 as unit on the vertical axis:
Not too bad a fit. Consider also that the booster campaign has been running for some time now, constantly increasing the headcount of the boosted, so we can’t expect to recover the 0.51 in older data (i.e., to the left of the diagram).
That leaves us with the “fully vaccinated”. Why is their incidence much lower than the other two, and why does the diagram of daily changes suggest discrete increments corresponding to multiples of around 0.4?
If the “fully vaccinated” population really was “fully vaccinated but not boosted”, population size (i.e., the denominator) would be around 0.75 x 364,000 – 196,000 – 25,641 ≈ 51,000, and we would detect increments corresponding to multiples of 100,000 / 51,000 ≈ 2. Instead, it’s 0.4, which is even less than for the boosted population. I conclude that the population that is being regarded as “fully vaccinated” here includes the boosted. The discrete unit is then 100,000 / (196,000 + 51,000) ≈ 0.4. For February 15th, this means 24.3 / 0.4 ≈ 61 people.
But what about the number of hospitalizations (i.e., the numerator)? It cannot include the boosted since we would then always see incidences at least as high as 196,000 / 247,000 ≈ 79% of the boosted incidence, which is clearly not the case.
So it seems (to me) that the boosted appear only in the denominator but not in the numerator. I have no idea why, but Hanlon’s Razor might apply.
Let’s wrap up: in the 14-day period until February 15th, 2022, around 219 adults (maybe a few more, but not less) have been hospitalized with Covid in Iceland. Of these, 23 are unvaccinated, 61 are fully vaccinated but not boosted (or have received a booster shot less than 14 days ago), and 135 have received a booster. Corresponding incidences per 100,000 are
90 for the unvaccinated (including, presumably, those who have received only one jab, or the second jab less than 14 days ago)
119 for the fully vaccinated but not boosted, or boosted less than 14 days ago; 119 = 61 x 100,000 / 51,000
69 for the boosted (i.e., boosted at least 14 days ago)
79 for all vaccinated, i.e., the two latter groups combined; 79 = (135 + 61) x 100,000 / 247,000
Aren’t they great, these “vaccines”?


