Back in March, I corrected the official Covid case rates for Germany by applying factors derived from GrippeWeb survey figures. Updates are difficult to get, but
’ latest report pointed to an alternative data source, wastewater monitoring.I collected these wastewater virus levels, multiplied them by 3,500 to get an estimate for the number of new infections per week (with 3,500, I hit both the GrippeWeb figures from summer of 2022 and RKI’s latest estimates (3 out of 100 means around 2.5 million out of 84 million). And this is what I get (black: official figures; red: figures adjusted according to GrippeWeb data, as of my previous post; green: estimates from wastewater virus levels):
Even the omicron wave of early 2022 pales in comparison. And what did we even measure in 2020 and 2021? I agree with
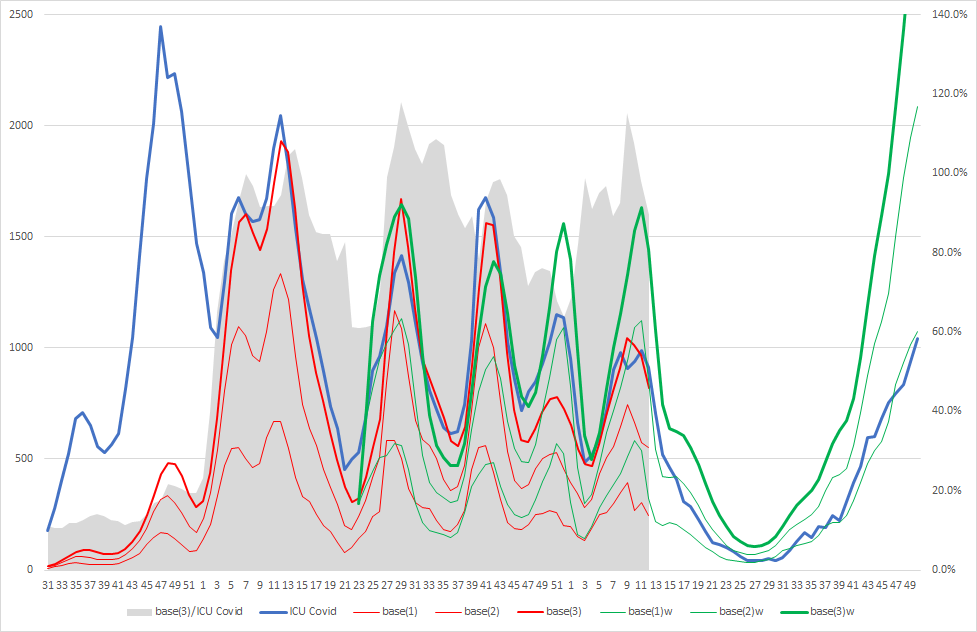
that the time series are pretty useless.Also, DIVI is still counting Covid ICU cases. Here’s another update of a previous diagram:
With the wastewater figures (w), even the baseline computed from the current week only (base(1)w) can fully explain ICU occupancy.
The virus does not profit from killing its hosts (and it almost never kills, these days), but it very much profits from spreading like crazy (and that’s what it does, these days). As far as I am concerned, the virus has won.
All the best for 2024, to all of you!


I don't think we can make assumptions about per capita prevalence based on wastewater prevalence.
Average viral loads are unlikely to be constant between variants.
Happy New Year! I make a point to check your stack often. Great work