


I’ve got this hammer called Credit Risk Modeling, and I declare Covid a nail.
Granting credit – that is, lending money – is the core business of banks. Obligors pay interest on their loans, and repay their loans at maturity. Or they do not, in which case the lending bank will likely suffer some loss. This potential for loss is called credit risk, and it is one of the main concerns of a bank’s risk management.
The main tool for credit risk measurement and management is a credit rating system. Each obligor is assigned a rating indicating their creditworthiness. Maybe you have heard about the “big three” rating agencies Standard&Poor’s, Moody’s and Fitch. They are (making money by) rating all those obligors that are of general interest. For example, German government bonds are labeled AAA (read “triple-A”), the best possible rating. Next in line is AA, then A, BBB, BB, B, and CCC (read “junk”). You might have noticed a similar scheme on a sticker to your fridge, indicating levels of energy efficiency.
How can you assess the quality of a rating system? Usually this is done using not one, but three concepts: discriminatory power, stability, and calibration.
Discriminatory power (or just power) refers to the rating system’s ability to distinguish between good and bad obligors. If you assign ratings at random, the rating system will be powerless. On the other hand, perfect power means correctly predicting which obligors will default. This requires a crystal ball, or some entrails to study.
Stability means persistence of power through space and time. Imagine a rating system for Berlin relying on street names. It may work very well, and you might be tempted to try it on Munich (after all, most streets in Germany are named after the same dead people or trees), only to discover that it fails miserably. High Stability means proper distinction of cause and effect. Low stability may be due to overfitting.
Finally, calibration is the statistical part. Each rating grade is assigned a probability of default (PD) over some period of time, usually one year. The PD for rating AAA might be something like one basis point (ie, one percent of one percent), the PD for rating CCC as large as 30%. Typically, PDs increase exponentially with rating. Note also that discriminatory power is what makes PDs close to 0 and close to 1 possible.
The credit rating system will then serve many purposes: credit risk decisions (credit policy forbids loans to obligors rated B or worse), credit risk compensation (the worse the rating, the higher the interest to be paid), and finally risk measurement and management. In that context, banks zoom out from single obligors and study credit risk at the portfolio level. What amount of money should we expect to lose over a one-year horizon? How bad might it get? For example, what is the 99.9% Value-at-Risk, the amount of money we will lose with probability 0.1% over this horizon? If we want to mitigate credit risk, what should we do? Should we sell parts of the portfolio, or buy credit risk protection/insurance, and which parts and at what cost?
Now, what does all that have to do with Covid? The portfolio is the people of Germany. The credit risk is the risk of death from Covid – which is convenient because we can still speak of the PD, this now being the probability of death.
How do we build a Covid rating system? Maybe like this. What factor has the biggest potential with respect to discriminatory power and stability? Age, quite clearly. For example, using the estimates from the Report 34 we get a nice Covid rating system with 19 rating classes (from 0-4, 5-9, to 90+) and PDs ranging from almost zero (for the youngest) to over 16% (for 90+). Now, these PDs are Infection Fatality Rates (IFR), so they require contact with the virus in the first place. On the other hand, so far we have not chosen a risk horizon. Let’s set this horizon so that contact with the virus becomes practically inevitable – somewhere between 5 and 10 years, I guess.
For convenience, we will cut the low-age rating classes slightly differently (0-11, 12-17, 18-24). Now we take the population of Germany (as of end of 2020, available from Statistisches Bundesamt) and the PDs (IFR with Seroreversion), and we compute an Expected Loss (Sum over no. of people times PD).
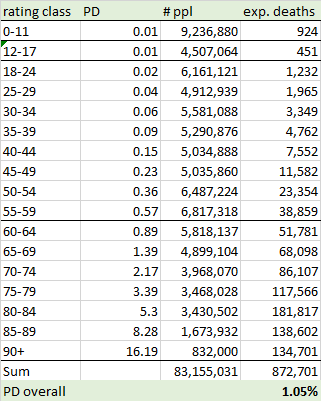
So, in the longer run, we might lose around 1.05% of the population to Covid, which is almost exactly the figure given in Report 34 for High Income Countries (HIC). Sounds quite horrible but is still less than the one-year all cause mortality rate (which is around 1.2% for Germany). Nevertheless, we might be tempted to look for risk mitigation.
Enter the vaccines. A lot has been promised, much less delivered. However, they still seem to have an effect of making you a few years younger, in Covid terms. That is, the vaccines can be understood as a rating upgrade. I am willing to grant 10 years gained, which translates into a 2-step upgrade (1-step for the 12-17 and 18-24 classes, no upgrade for kids).
But what about the cost? Side effects seem to be seriously under-reported. The main point is that there are different side effects for different age groups (and for different vaccines), so I propose working with fixed cost per person vaccinated. In other words, age does not offer much discriminatory power in terms of vaccine side effects. In order to determine this fixed cost we have to use the same horizon (5 to 10 years) as for our Covid rating system. Based on current hysteria, this might mean 20 boosters. My estimate for probability of death from a single dose is 0.001% (that’s the order of magnitude the Paul Ehrlich institute is operating with: around 1,000 suspicious deaths per 100,000,000 doses – they might be acknowledging much less as actually being due to the vaccine only, but hey, much less care is usually applied to Covid deaths). With 20 boosters, we are at around 0.02%.
If this makes any sense (and even if I am off by some factor here or there), one thing is clear: DON’T VACCINATE CHILDREN (at least not without further discrimination)!
But let’s leave the future aside (it’s too bleak) and see where we are at the moment. The Robert Koch Institut (RKI, the institution responsible for Covid monitoring in Germany), in its wisdom, decided to only record the numbers of vaccinations stratified by three age groups: 12-17, 18-59, and 60+ (so far, almost no kids 0-11 have been vaccinated, thank God). Current proportions in these three groups are around 50%, 75% and 86%, which means 68.5% of the population.
Since detailed information is not available (to me, and presumably to anyone else) we will analyze three scenarios:
Scenario 1: within the groups 18-59 and 60+, proportions of vaccinated are equal for each rating class.
Scenario 2: within the groups 18-59 and 60+, vaccinations accumulate at the older end, ie, we “fill up” from oldest rating class to youngest.
Scenario 3: within the groups 18-59 and 60+, vaccinations accumulate at the younger end, ie, we “fill up” from youngest rating class to oldest.
Scenario 1 might be explained by pure ignorance, scenario 2 by prioritization of those that would profit most, and scenario 3 by sheer capacity (to leave the house and go to the vaccination station, for example) or trade-offs (it might not make sense to vaccinate very old and frail people on their death beds). All three scenarios are wrong, but they are useful to study effects.
Let’s start with scenario 1 (what else):

First of all, what effect has the selection of people for vaccination on PD? The a priori PD (that is, before vaccination) for the vaccinated group is 1.3%, compared to 0.51% for the unvaccinated group. At least the selection in this scenario seems to be sensible: the to-be-vaccinated are more vulnerable to the virus than the unvaccinated. But what is the effect of vaccination? The a posteriori PD (considering the rating upgrade and the cost of vaccination) amounts to 0.53%. That is, by vaccination (and neglecting deaths from vaccines) we have made the two groups approximately equal! Yes, the PD in the unvaccinated group might be lowered by vaccination but it is clear, in this scenario, that speaking of a “pandemic of the unvaccinated”, as politicians and media do in Germany, is unjustified. Note also that, due to vaccination cost, PD has increased for the age groups 11-17 and 18-24 among the vaccinated.
Here are the same stats for scenario 2:

In this scenario, selection of candidates for vaccination is even better, with a priori PDs of 1.47% (vaccinated) and 0.13% (unvaccinated). Even after vaccination, however, PD among the vaccinated is much larger than among the unvaccinated. Further vaccination is pointless.
And finally scenario 3:

In this scenario, selection of candidates for vaccination has gone wrong, with a priori PDs of 0.87% (vaccinated) and 1.43% (unvaccinated). Most of the effect, of course, is due to the 85+ groups that are both most at risk from Covid and assumed to be unvaccinated. This scenario is worst in terms of total deaths.
I’ll leave it at that. The rest is homework: Where should the next million vaccinations go to? How many teenagers would you have to vaccinate to obtain the same effect as for vaccinating one 85-year old? Are there more sensible scenarios (eg, can you map the UK vaccination profile onto Germany)?
Anyway. If the RKI was the credit risk management unit of a bank, it would have been shut down long ago (by the board or by the supervisory authority). This is not a pandemic of the unvaccinated but of the innumerate. Politicians, invest in hospitals and care, and leave us alone!
This blast-from-the-past is good perspective, although that Paul Ehrlich Institute estimate of just 10 suspicious deaths per million COVID mRNA shots is too low. Even just the deaths reported to VAERS for Moderna came in at a rate of over 30 death reports per million doses.
And VAERS, itself, underestimates true death.
This is a great way to explain managing risks ! I found this article because of your link to it in your January 2024 article. Better late than never...