
With the door to The Lancet still wide open, government-approved science imitators are rushing to get their countries on the list of places where Covid vaccines worked wonders. So the HDR UK COALESCE Consortium also went up, “to investigate the risk of severe COVID-19 outcomes in people who were undervaccinated in each UK nation and across the UK” because they belonged to the house and line of Health Data Research UK.
For general commentary, please also read Norman Fenton and Martin Neil, and The Naked Emperor. I will add to this by diving into one particular table from the (85 pages of!) supplementary data to the paper. I hope to be able to give an impression of the types of problems to be found, again and again, in studies like this.
The table is S6F from p. 53, reproduced here with the two orphaned lines on p. 54 added:
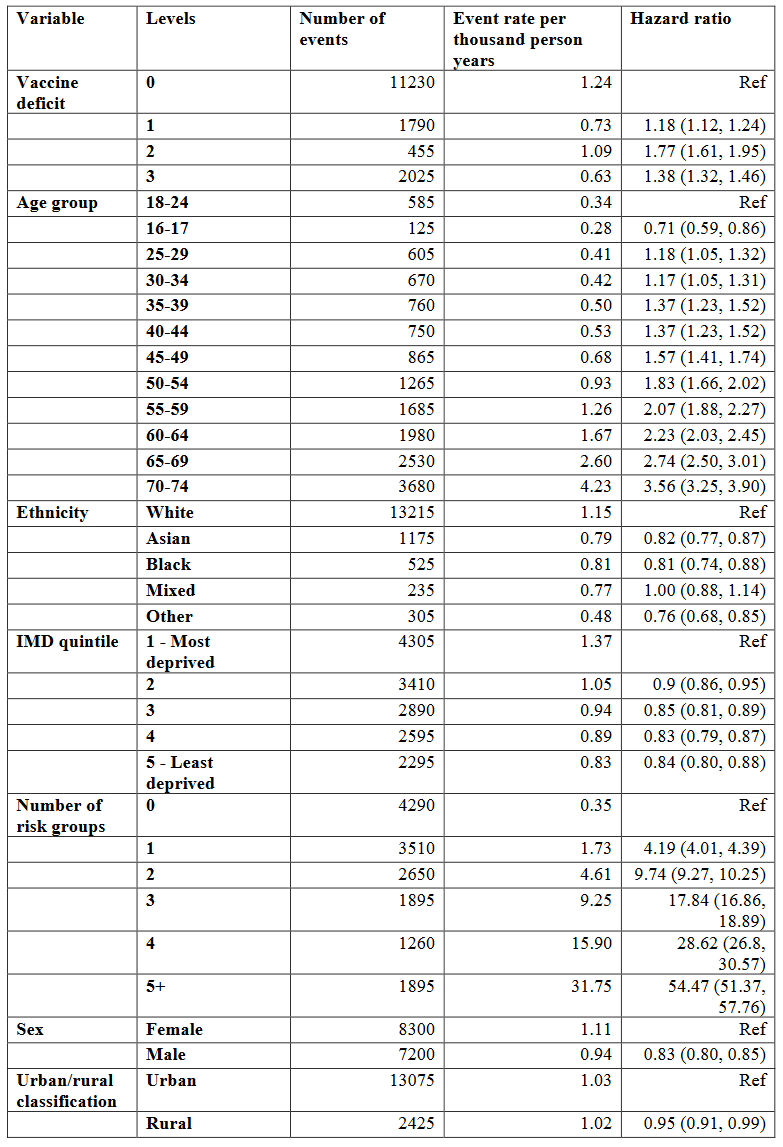
These are results for England (there are analogous tables for the other nations as well, but these nations are much smaller and the numbers swamped by uncertainty anyway), specifically: “Multifactorially adjusted hazard ratios and 95% confidence intervals for COVID-19 hospitalisation or death, common adjustment analysis, age 16-74, England”. Over a period of four months, severe events (basically, COVID-19 hospitalisation or death) were recorded, 15,500 in total, and then dumped into a model the outcomes of which are presented in the most right column.
The model, of course, is Cox regression (How could it be different?), and it produces hazard ratios, a factor between hazard rates (i.e., probabilities) for certain events, all else being equal but a specific variable. For example, the hazard ratio between rural and urban is 0.95, indicating that in general, people living in the country experience severe Covid events at a rate of only 95% (with confidence interval from 91% to 99%) of those people living in the city.
Why the model, you ask? Wouldn’t it be sufficient to compute quotients of event rates (second column from the right), the “raw ratios”? Indeed this is an excellent idea:

For almost all variables, raw ratios and hazard ratios are close. In particular, both are either smaller than one or larger than one. The only exceptional category is vaccine deficit. Somehow, raw ratios smaller than one (indicating that having received fewer vaccinations is beneficial regarding severe Covid) have been transformed into hazard ratios larger than one (indicating the opposite).
What is going on here? To me, the likely explanation is a kind of Simpson effect: there are other categories (age, and number of risk groups) with remarkable discriminatory power, and the hazard ratios for vaccine deficit are the model’s lame attempt to attribute some of this power to a different variable.
In plain English, discriminatory power is a statistical model’s ability to a priori distinguish between the “good” (low event probability) and the “bad” (high event probability (you might consult my very first substack post from Dec 2021 for examples from credit rating modelling). For example, the number of risk groups has incredible power, with a factor of more than 90 between event rates, and more than 50 between hazard rates, for the best and worst groups. In a situation like this, hazard ratios close to one are almost meaningless, except as confirmation that the variable does not play a role.
If I were peer reviewer of the paper, at this point I would demand further analysis within categories: drop domicile, sex, deprivation quintile and ethnicity (or should we discuss possible discrimination against white people, because they exhibit the largest raw rates and hazard rates?), and study specific combinations of risk group and age. For example, what hazard ratio for vaccine deficit 3 versus 0 would result for people in the 50-54 age category in risk group 2? And don’t try to escape via the too-small-sample route! In this neck of the statistical woods, people are invoking spells like the one-in-ten rule.
Unfortunately, we will never know. But even if we take the hazard ratios at face value and transform them into measures of vaccine effectiveness (one minus one over hazard ratio), we get something like 1 - 1 / 1.38 = 27.5% for maximum booster (3 doses) against no vaccination at all, a number that would never have gotten a “vaccine” past the regulatory goalposts back then when there was some sense in the world.
The authors of the paper go on to claim that, based on these estimates on vaccine effectiveness, many of the severe Covid events could have been avoided if only everybody had taken the full salvo. For our subsample, the number computed is 1,033 (of 4,270, cf. Table S6b on p. 50 of the supplementary material). I get 1,029, but this is due to the rounding of the hazard ratios to two digits.
Sounds great (and by postmodern woke logic, we might even avoid 1,411 events by declaring us all men), until you estimate the number of vaccinations required.

For example, 11,230 events divided by an event rate of 1.24/1,000 give 9,056,452 person years. Since these are the people blessed with three vaccinations, and since the study covers four months (i.e., a third of a year), they must have received something like 9,056,452 * 3 * 3 = 81,508,065 jabs. I’ll leave the rest of the table as homework.
So in order to profit from the reduction in severe Covid events of 1,033, one would have to dish out almost 39 million jabs. Even the hands-down favorite for most incompetent of medical supervisory authorities, our German Paul Ehrlich-Institut (PEI), has recorded a rate of 0.28 severe adverse events per 1,000 jabs. That would amount to 10,861 such events in the situation of the paper. Dear authors, are you really willing to risk a number of severe adverse events that is ten times your hoped-for positive effect? And no, this is not apples versus oranges regarding time. If the vaccines have any effect at all, after four months it will be pretty much gone. Or why the continuous advertising for seasonal boosters?
I agree, the paper is a joke and should never have been published. Unfortunately, the joke is on science, and on us.
Vax injured in '68, antibiotic injured as an adult with many other medical horror stories. Just released first Substack explaining "coincidist", my new term for folks who blame pharmaceutical harm on coincidence. Some are believers, others are shills...
https://open.substack.com/pub/coincidism/p/counter-coincidism-101?
Thank you very much" I agree with you and Fenton/Neill.
Nevertheless, I have 2 questions:
The authors defined the time window of interest as "June 1 to Sept 30, 2022", i.e. the 4 typically warm summer months.
1. Almost all individual observations (apart from those in the very old) lasted 4 months, nevertheless the authors preferred a time adjustment?
For hiding problems in the model?
2. I am surprised with the chosen time window (sorry, I did not completely read the articlle), as incidence of C19 should be rather low during summer.
Meaning: Even if data and model would be correct. it might tell us very little for the reat of the year.